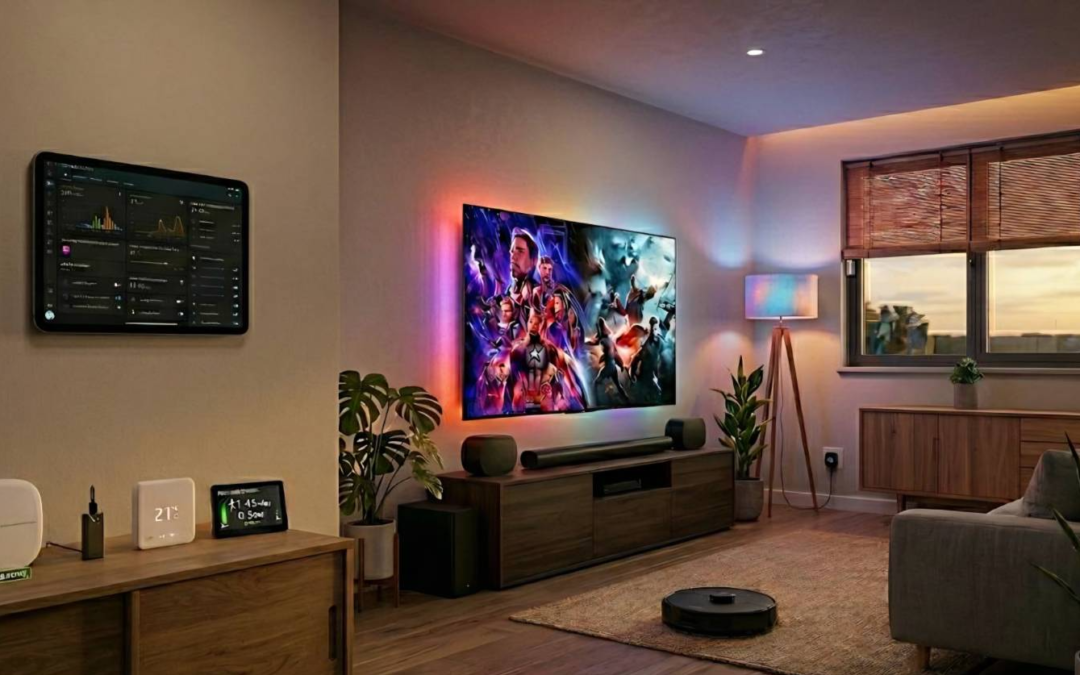
Bridging the Gap: Adapting a Wireshark Escher Lua Dissector for NetScout InfiniStreamNG

Bridging the Gap: Adapting a Wireshark Escher Lua Dissector for NetScout InfiniStreamNG

🔍 Introduction: The Need for Custom Protocol Visibility

In modern telecom and enterprise networks, proprietary or niche protocols often operate under the radar of standard monitoring tools. For example, the Escher protocol, a binary protocol used in charging and session management systems, lacks native support in most commercial monitoring platforms. While my earlier Wireshark Lua dissector provided a way to decode and analyse Escher traffic offline, the real challenge was bringing this visibility into a production-grade monitoring environment like NetScout’s nGeniusONE.

This post explores how to adapt a Wireshark Lua dissector for real-time protocol dissection in NetScout InfiniStreamNG, enabling live monitoring, troubleshooting, and analytics for custom protocols within the nGeniusONE Service Assurance platform.

🌟 Why NetScout nGeniusONE?

Before diving into the technical details, it’s worth highlighting why NetScout nGeniusONE is the ideal platform for this kind of custom protocol integration. nGeniusONE is a comprehensive service assurance solution designed to provide end-to-end visibility across physical, virtual, and cloud environments. Here’s how it stands out:

📌 Key Benefits of NetScout nGeniusONE

FeatureBenefitRelevance to Custom Protocols
Real-Time VisibilityMonitors live traffic with sub-second latency, enabling immediate detection of issues.Custom protocols like Escher can be monitored in real-time, not just post-mortem.
Adaptive Session Intelligence (ASI)Uses deep packet inspection (DPI) to automatically classify and analyse traffic.ASI can recognise standard protocols (e.g., Diameter, SIP, HTTP), while custom Lua scripts handle proprietary ones like Escher.
End-to-End CorrelationCorrelates multi-protocol sessions (e.g., Diameter + Escher + HTTP) for holistic troubleshooting.Enables tracking of Escher messages alongside standard protocols in a single workflow.
Custom Dashboards and AlertsCreate tailored dashboards and proactive alerts based on custom metrics.Custom fields from the Escher dissector (e.g., escher.ACTN, escher.TYPE) can power real-time dashboards and alerts.
Scalable ArchitectureHandles 10Gbps+ traffic with distributed probes (InfiniStreamNG, vSTREAM).Lua scripts run directly on the probe, ensuring low-latency processing even at scale.
Historical and Trend AnalysisStores long-term data for trend analysis, capacity planning, and forensic investigations.Custom protocol data can be historically analysed alongside other network metrics.
Unified WorkflowSingle pane of glass for network, application, and service-layer visibility.Escher traffic can be seamlessly integrated with other protocols in nGeniusONE’s UI.
Open ExtensibilitySupports custom Lua scripts for proprietary protocols and REST APIs for integration.Enables adaptation of Wireshark dissectors and other custom logic.

🖼️ Architecture Overview

Here’s how the custom Escher dissector fits into the nGeniusONE ecosystem:

Diagram: Custom Escher Dissector in NetScout nGeniusONE Architecture

🧩 The Challenge: From Wireshark to InfiniStreamNG

While Wireshark is an excellent tool for offline protocol analysis, it has limitations for production environments:

  • No real-time processing: Wireshark dissectors run in a desktop app, not on live traffic.
  • No integration with monitoring platforms: Insights from Wireshark cannot directly feed into dashboards, alerts, or automated workflows in tools like nGeniusONE.
  • Manual effort: Engineers must manually capture and analyse PCAPs, which is not scalable for 24/7 operations.

NetScout InfiniStreamNG solves these issues by allowing custom Lua scripts to run directly on the probe, enabling real-time dissection of proprietary protocols like Escher.

🔧 The Adaptation Process: Key Steps

Adapting a Wireshark Lua dissector for InfiniStreamNG requires addressing fundamental differences between the two environments. Below are the critical steps and considerations:

1. Understand the Protocol Structure

The Escher protocol uses a binary format with:

  • MAPs (key-value pairs, similar to JSON objects).
  • ARRAYs (ordered lists).
  • Scalar types (INT32, INT64, SYMBOL, STRING, etc.).
  • Nested structures (MAPs/ARRAYs can contain other MAPs/ARRAYs).

Example Escher MAP structure:

[0:2]   u16  total_byte_length
[2:4]   u16  num_items
[4:8]   u32  internal_ptr
[8:]    Index entries (4 bytes each):
         bits [31:13]  symbol value (19 bits, base-27 encoded)
         bits [12:9]   typecode (4 bits)
         bits [8:0]    data_offset (9 bits, in 4-byte words from MAP start)

2. Replace Wireshark APIs with InfiniStreamNG Equivalents

Your Wireshark dissector relies on Wireshark’s Lua API, which is GUI-focused and not compatible with InfiniStreamNG. Here’s how to map the key functions:

Wireshark LuaInfiniStreamNG LuaExample
tvb(offset, length):uint()payload:uint32_be(offset + 1)local total_len = payload:uint16_be(offset + 1) (1-based indexing).
tvb(offset, length):int64()payload:int64_be(offset + 1)local val = payload:int64_be(data_offset + 1)
tree:add(proto, tvb, label)packet:add_custom_field(name, value)packet:add_custom_field("escher.ACTN", "REQ ")
DissectorTable.get("tcp.port")register_dissector(name, port, func)register_dissector("ESCHER", 1500, dissect_escher)
bit.band(), bit.rshift()Same (InfiniStreamNG includes bit library).local typecode = bit.band(bit.rshift(entry_raw, 9), 0x0F)

3. Handle Big-Endian Fields Explicitly

InfiniStreamNG provides explicit big-endian methods for multi-byte fields. Replace all multi-byte reads with:

  • payload:uint16_be(offset)
  • payload:uint32_be(offset)
  • payload:int64_be(offset)

Example:

4. Optimise for Performance

Example:

-- Wireshark:
local total_len = tvb(offset, 2):uint()

-- InfiniStreamNG:
local total_len = payload:uint16_be(offset + 1)  -- +1 for 1-based indexing

InfiniStreamNG probes process millions of packets per second, so your Lua script must be highly optimised:

  • Cache repeated lookups (e.g., FIELD_LABELS[sym_name]).
  • Avoid loops over large tables (e.g., pairs(FIELD_LABELS)).
  • Minimise add_custom_field calls (each call adds overhead).
  • Use local variables (Lua accesses locals faster than globals).
-- ❌ Slow (repeated global lookups):
for i = 0, num_items - 1 do
    local sym_name = decode_symbol(payload:uint32_be(idx_off + 1))
    local label = FIELD_LABELS[sym_name] or sym_name
    packet:add_custom_field("escher." .. sym_name, label)
end

-- ✅ Faster (local references):
local FIELD_LABELS_LOCAL = FIELD_LABELS
for i = 0, num_items - 1 do
    local sym_val = payload:uint32_be(idx_off + 1)
    local sym_name = decode_symbol(sym_val)
    local label = FIELD_LABELS_LOCAL[sym_name] or sym_name
    packet:add_custom_field("escher." .. sym_name, label)
end

5. Validate All Offsets and Lengths

InfiniStreamNG does not gracefully handle out-of-bounds buffer access. Always validate:

if offset + 4 > payload:len() then return 0 end
local total_len = payload:uint32_be(offset + 1)

⚡ Performance Considerations

1. Probe Resource Usage

InfiniStreamNG probes are high-performance appliances, but Lua scripts do consume CPU and memory. Here’s what to monitor:

MetricImpactTarget
CPU UsageLua dissection adds ~1-5% CPU per Gbps of traffic.Keep total Lua CPU usage <20% to avoid impacting other probe functions.
Memory UsageEach Lua script consumes ~1-10MB (depends on tables like FIELD_LABELS).Monitor with show memory in the probe CLI.
LatencyAim for <1ms per packet to avoid impacting probe performance.Test with show lua stats to measure script execution time.

2. Optimisation Techniques

To ensure your dissector runs efficiently on InfiniStreamNG:

TechniqueImpactExample
Limit Custom FieldsReduces add_custom_field calls (each adds ~1-2μs overhead).Only extract ACTN, TYPE, CMID (not every field).
Cache LookupsAvoids repeated table accesses (e.g., FIELD_LABELS[sym_name]).Use local variables: local FIELD_LABELS_LOCAL = FIELD_LABELS.
Avoid LoopsLua loops are slow; unroll or minimise iterations.Precompute offsets; avoid for i=1,1000.
Use 1-Based IndexingInfiniStreamNG Lua uses 1-based strings (unlike Wireshark’s 0-based tvb).payload:sub(1, 4) (not payload:sub(0, 3)).
Limit Recursion DepthPrevents stack overflows in deeply nested structures.if depth > 20 then return end.
Validate OffsetsPrevents crashes from malformed packets.if offset + 4 > payload:len() then return 0 end.

3. Testing and Validation

Lab Testing

  • Deploy the script to a non-production InfiniStreamNG probe:
scp escher_dissector.lua admin@<probe_ip>:/netscout/lua_scripts/
ssh admin@<probe_ip> "lua_load escher_dissector.lua"
  • Replay test traffic (e.g., using tcpreplay):
tcpreplay -i eth0 -p 1500 escher_traffic.pcap
  • Monitor probe performance:
    • CPU: top, htop.
    • Lua Errors: tail -f /var/log/netscout/lua_errors.log.
    • Custom Fields: Verify in nGeniusONE (e.g., escher.ACTN, escher.TYPE).

Production Rollout

  • Start with a subset of traffic (e.g., one probe, one port).
  • Monitor for 24-48 hours before full deployment.
  • Fallback plan: Disable the script if performance degrades:
ssh admin@<probe_ip> "lua_unload escher_dissector.lua"

📈 Use Cases in nGeniusONE

Once the dissector is deployed, you can leverage the custom fields in nGeniusONE for:

1. Real-Time Dashboards

Create custom dashboards in nGeniusONE to monitor:

  • Escher Message Types (e.g., REQ, HTBT, EXCP).
  • Error Rates (e.g., escher.ACTN == "EXCP").
  • Traffic Volume (e.g., bytes/sec, messages/sec).

Example Dashboard Widgets:

WidgetMetricVisualisation
Top Escher Message Typesescher.ACTN (count by type)Bar Chart
Escher Errors Over Timeescher.ACTN == "EXCP" (count)Line Graph
Escher Traffic Volumeescher.map.total_len (sum)Area Chart
Escher LatencyTime between REQ and RESPHistogram

2. Alerts and Troubleshooting

Configure proactive alerts in nGeniusONE for:

  • High error rates (e.g., escher.ACTN == "EXCP" > 5/min).
  • Missing heartbeats (e.g., no escher.TYPE == "HTBT" for 60s).
  • Unusual message types (e.g., unknown escher.ACTN).

Example Alert Rule:

IF (escher.ACTN == "EXCP") AND (count > 5) THEN
    trigger "Escher Error Spike" (Severity: High)
    notify: Email, SMS
END

3. Session Analysis

Use nGeniusONE’s Session Analyzer to:

  • Track end-to-end call flows: Correlate REQRESP sequences.
  • Link Escher to other protocols: For example, tie Escher EXCP messages to Diameter 4010 (Insufficient Funds) responses.
  • Drill down into individual sessions: Inspect raw Escher messages alongside Diameter/SIP.

Example Workflow:

  1. Filter for sessions with escher.ACTN == "EXCP".
  2. Drill down to see the full Escher message (including BODY and HEAD fields).
  3. Correlate with Diameter Gy messages in the same session.

4. Historical Analysis

Leverage nGeniusONE’s historical data to:

  • Trend Escher traffic over time (e.g., daily/weekly patterns).
  • Identify anomalies (e.g., spikes in EXCP messages).
  • Compare with other protocols (e.g., Escher vs. Diameter latency).

Example Historical Report:

  • Escher Traffic Trends: Messages/sec over the last 30 days.
  • Error Correlation: Compare escher.ACTN == "EXCP" with Diameter Result-Code == 4010.

🔗 Resources and Further Reading

🚀 Conclusion: Unlocking Full Visibility with Custom Dissectors

Adapting a Wireshark Lua dissector for NetScout InfiniStreamNG bridges the gap between offline analysis and real-time monitoring. By leveraging InfiniStreamNG’s Lua scripting capabilities, you can:
✅ Monitor proprietary protocols (like Escher) in real-time.
✅ Integrate with nGeniusONE for dashboards, alerts, and troubleshooting.
✅ Gain end-to-end visibility into custom and standard protocols in a single pane of glass.

While the adaptation process requires careful attention to performance and API differences, the payoff is production-grade visibility into previously opaque traffic. This approach is not just for Escher, it can be applied to any custom protocol in your network, unlocking new levels of observability and control.

Have you adapted a Wireshark dissector for InfiniStreamNG or another monitoring tool? Share your experiences!

Author Bio
Tony Craven is a telecom and network solutions architect with over 20 years of experience in Oracle Communications Network Charging and Control (OCNCC) and real-time protocol analysis. He is a strategic technology executive with proven leadership in telecommunications, IoT, and SaaS, specialising in scalable, cloud-based solutions for global enterprises and startups. Adept at bridging vision and execution, from post-merger technical integration to architecting high-availability infrastructure supporting millions of IoT devices.

Troubleshooting Oracle OCNCC Without Logging: Introducing the Escher Wireshark Plugin

The Hidden Struggle of Debugging OCNCC

Debugging Oracle Communications Network Charging and Control (OCNCC) has long been a pain point for telecom engineers who operate the platform in production environments. The traditional approach, enabling debug logging, floods systems with verbose output, degrades performance, and is often impractical in live environments. For years, this left teams with a tough choice: either accept limited visibility or risk operational instability.

But what if there was a way to bypass the logs entirely and inspect OCNCC’s inner workings at the packet level? That’s exactly what my new Wireshark dissector for the Escher protocol achieves. After months of reverse-engineering, hex-dump analysis, and collaboration with AI (Claude, in my case), I’ve built a tool that decodes Escher traffic in real time, no logging required.

In this post, I’ll share:

  • The challenges of debugging OCNCC with traditional methods.
  • How the Escher protocol works and why it’s so hard to inspect.
  • The solution: A custom Wireshark dissector that brings clarity to Escher traffic.
  • How you can licence this tool to streamline your own OCNCC troubleshooting.

The Problem: Why Debugging OCNCC is a Headache

1. The Limitations of Debug Logging

OCNCC’s debug logging is a double-edged sword. While it provides detailed insights into system behaviour, it comes with major drawbacks:

  • Performance Overhead: Enabling debug mode can slow down your OCNCC instance, making it unsuitable for production environments.
  • Information Overload: Logs generate massive volumes of data, making it difficult to isolate the root cause of issues.
  • No Real-Time Analysis: Debug logs are reactive, you only see problems after they’ve occurred.

For engineers like me, this meant spending hours sifting through logs, often with no guarantee of finding the answer.

2. The Escher Protocol: A Black Box

OCNCC uses a proprietary protocol called Escher for internal communication. While you can capture Escher traffic in PCAP files (via tools like tcpdump or Wireshark), the lack of native support in Wireshark renders these captures useless for analysis. Without a dissector, Escher packets appear as undecoded hex dumps, a wall of numbers and letters with no context.

Without a dissector, Escher traffic is just a wall of hex, impossible to interpret.

The Protocol: Escher 101

The ESCHER protocol, is a compact binary messaging format designed for efficient, structured data exchange over TCP. At its core, ESCHER represents data as typed key–value maps and arrays, where keys are encoded as fixed 4-character symbols and values are strongly typed (integers, floats, strings, dates, nested objects, etc.). Messages are tightly packed with alignment and indexing structures that allow fast lookup and minimal overhead, making the format well-suited to high-performance environments such as real-time billing or transaction processing systems.

The protocol operates over standard network layers by embedding ESCHER payloads inside TCP packets, which can then be captured and analysed using PCAP tooling like Wireshark, although decoding is not available without natively.

A key design feature is the deterministic encoding of fields and ordering of keys, enabling efficient binary search within messages and consistent interoperability between systems. Combined with its compact wire format and explicit typing, ESCHER strikes a balance, when decoded, between human-readable structures and, when encoded, a highly optimised binary transport, making it particularly effective for systems that require both performance and traceability.

The Solution: A Wireshark Dissector for Escher

How It Works

After countless hours of analysing hex dumps, cross-referencing with debug logs, and writing Lua scripts (with a little help from Claude AI), I’ve created a Wireshark dissector that:

  • Decodes Escher packets at the protocol level, revealing their structure and fields.
  • Enables filtering directly in Wireshark (e.g., escher.msg_type == WI).
  • Works in real time, so you can monitor live traffic without touching OCNCC’s logging framework.
From hex dumps to clarity: The dissector reveals Escher’s structure in Wireshark.”

Key Features

FeatureBenefit
Packet-Level DecodingSee Escher messages as human-readable data in Wireshark.
FiltersFilter traffic by protocol fields, e.g.:
  • escher – All ESCHER packets
  • escher.val.string contains “RuntimeError” – Packets containing a specific string value
  • escher.val.symbol == “WI ” – Packets where any symbol field equals WI
  • escher.val.int32 == 12 – Packets where any INT32 field equals 12
  • escher.val.date – Packets that contain a DATE field
  • escher.map.items > 3 – Top-level maps with more than 3 items
  • escher.entry.raw == 0x00f80606 – Packets containing a specific raw index entry
No Performance ImpactRuns independently of OCNCC, so no risk to production systems.

Why This Matters for OCNCC Engineers

1. Faster Troubleshooting

With the dissector, you can:

  • Isolate issues by filtering for specific Escher message types or error codes.
  • Validate protocol compliance without relying on logs.
  • Monitor live traffic to catch problems as they happen.

2. Reduced Risk in Production

Since the dissector doesn’t require debug logging, you can:

  • Analyse traffic without impacting OCNCC performance.
  • Use it in live environments where logging is prohibited.

3. A Tool Built by an Engineer, for Engineers

This isn’t a theoretical solution, it’s a practical tool born from real-world frustration. As someone with 20+ years of OCNCC, and real-time charging experience, I designed this dissector to solve the exact problems my team faced in the field.

The new workflow: No logs, no guesswork, just clarity.

How to Get the Escher Wireshark Dissector

The dissector is available for licensing to organisations and individuals who need to debug, monitor, or analyse OCNCC traffic. Here’s how to get it:

Licensing Options

OptionDescriptionBest For
Single-User LicenseOne-time fee for personal use (non-commercial).Independent engineers.
Team LicenseUp to 10 users within a single organisation.Small to medium telecom teams.
Enterprise LicenseUnlimited users + customisation support.Large enterprises or MNOs.
Custom DevelopmentNeed additional features or integration with other tools? Let’s talk.Tailored solutions.

Next Steps

  1. Contact Me: Reach out via the contact form to discuss your needs.
  2. Demo Available: I can provide a short demo of the dissector in action (via screen share).
  3. Customisation: Need support for a specific OCNCC version or functionality? I can tailor the dissector or build SDK solutions to your requirements.