The Hidden Struggle of Debugging OCNCC
Debugging Oracle Communications Network Charging and Control (OCNCC) has long been a pain point for telecom engineers who operate the platform in production environments. The traditional approach, enabling debug logging, floods systems with verbose output, degrades performance, and is often impractical in live environments. For years, this left teams with a tough choice: either accept limited visibility or risk operational instability.
But what if there was a way to bypass the logs entirely and inspect OCNCC’s inner workings at the packet level? That’s exactly what my new Wireshark dissector for the Escher protocol achieves. After months of reverse-engineering, hex-dump analysis, and collaboration with AI (Claude, in my case), I’ve built a tool that decodes Escher traffic in real time, no logging required.
In this post, I’ll share:
- The challenges of debugging OCNCC with traditional methods.
- How the Escher protocol works and why it’s so hard to inspect.
- The solution: A custom Wireshark dissector that brings clarity to Escher traffic.
- How you can licence this tool to streamline your own OCNCC troubleshooting.
The Problem: Why Debugging OCNCC is a Headache
1. The Limitations of Debug Logging
OCNCC’s debug logging is a double-edged sword. While it provides detailed insights into system behaviour, it comes with major drawbacks:
- Performance Overhead: Enabling debug mode can slow down your OCNCC instance, making it unsuitable for production environments.
- Information Overload: Logs generate massive volumes of data, making it difficult to isolate the root cause of issues.
- No Real-Time Analysis: Debug logs are reactive, you only see problems after they’ve occurred.
For engineers like me, this meant spending hours sifting through logs, often with no guarantee of finding the answer.
2. The Escher Protocol: A Black Box
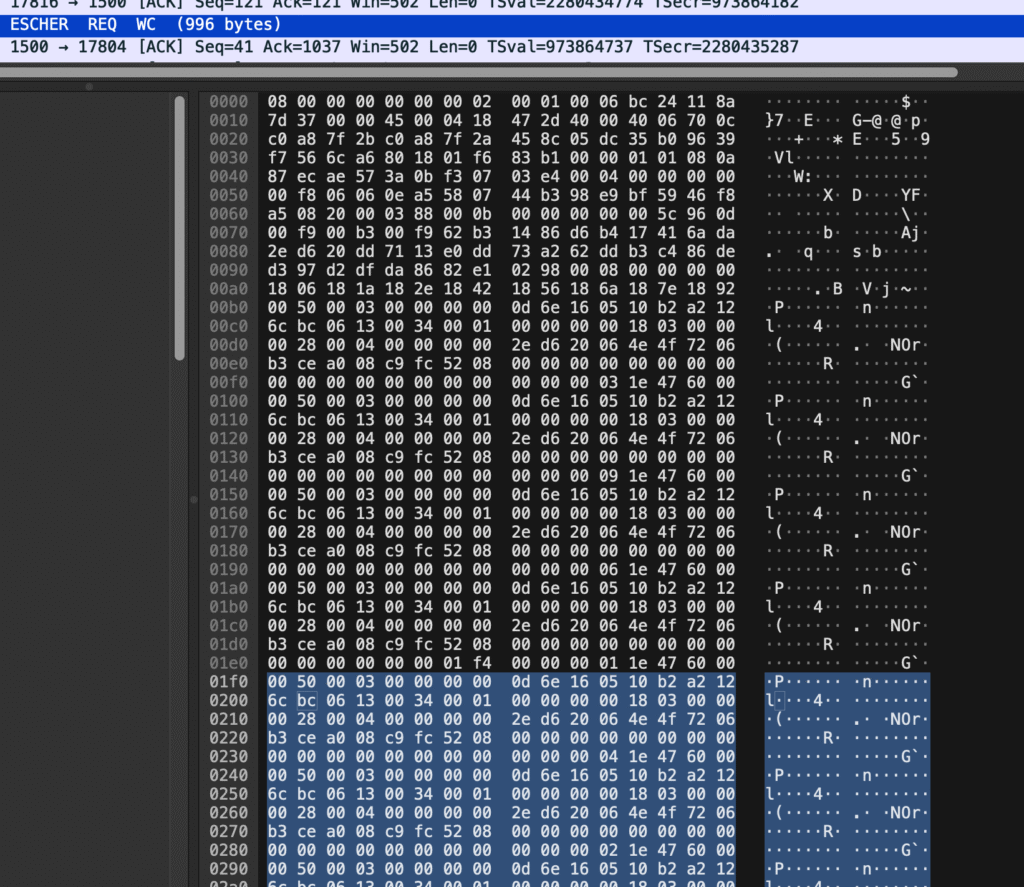
OCNCC uses a proprietary protocol called Escher for internal communication. While you can capture Escher traffic in PCAP files (via tools like tcpdump or Wireshark), the lack of native support in Wireshark renders these captures useless for analysis. Without a dissector, Escher packets appear as undecoded hex dumps, a wall of numbers and letters with no context.
The Protocol: Escher 101
The ESCHER protocol, is a compact binary messaging format designed for efficient, structured data exchange over TCP. At its core, ESCHER represents data as typed key–value maps and arrays, where keys are encoded as fixed 4-character symbols and values are strongly typed (integers, floats, strings, dates, nested objects, etc.). Messages are tightly packed with alignment and indexing structures that allow fast lookup and minimal overhead, making the format well-suited to high-performance environments such as real-time billing or transaction processing systems.
The protocol operates over standard network layers by embedding ESCHER payloads inside TCP packets, which can then be captured and analysed using PCAP tooling like Wireshark, although decoding is not available without natively.
A key design feature is the deterministic encoding of fields and ordering of keys, enabling efficient binary search within messages and consistent interoperability between systems. Combined with its compact wire format and explicit typing, ESCHER strikes a balance, when decoded, between human-readable structures and, when encoded, a highly optimised binary transport, making it particularly effective for systems that require both performance and traceability.
The Solution: A Wireshark Dissector for Escher
How It Works
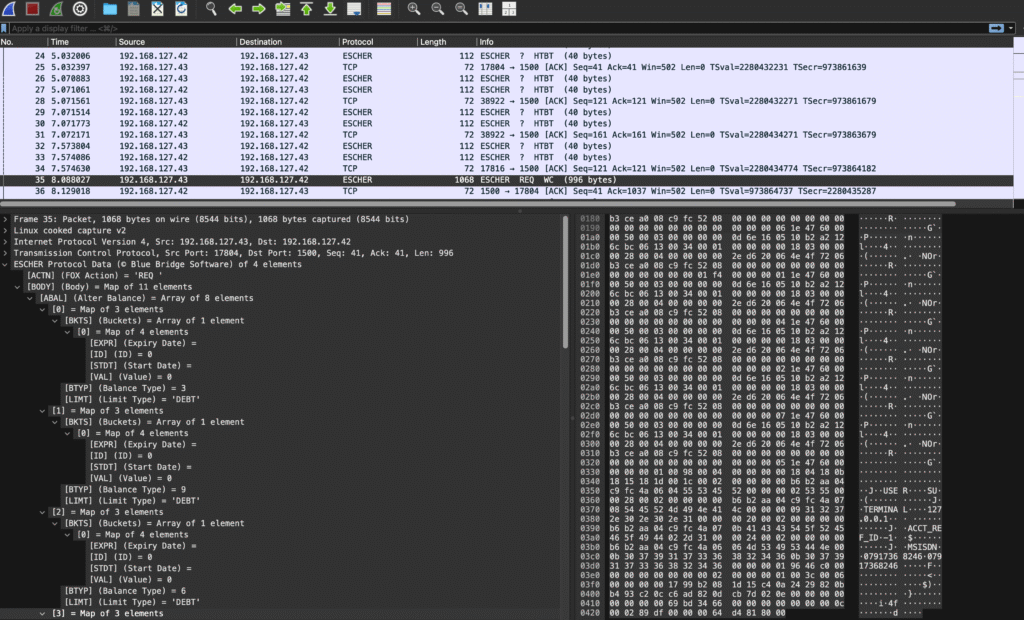
After countless hours of analysing hex dumps, cross-referencing with debug logs, and writing Lua scripts (with a little help from Claude AI), I’ve created a Wireshark dissector that:
- Decodes Escher packets at the protocol level, revealing their structure and fields.
- Enables filtering directly in Wireshark (e.g.,
escher.msg_type ==WI). - Works in real time, so you can monitor live traffic without touching OCNCC’s logging framework.
Key Features
| Feature | Benefit |
|---|---|
| Packet-Level Decoding | See Escher messages as human-readable data in Wireshark. |
| Filters | Filter traffic by protocol fields, e.g.:
|
| No Performance Impact | Runs independently of OCNCC, so no risk to production systems. |
Why This Matters for OCNCC Engineers
1. Faster Troubleshooting
With the dissector, you can:
- Isolate issues by filtering for specific Escher message types or error codes.
- Validate protocol compliance without relying on logs.
- Monitor live traffic to catch problems as they happen.
2. Reduced Risk in Production
Since the dissector doesn’t require debug logging, you can:
- Analyse traffic without impacting OCNCC performance.
- Use it in live environments where logging is prohibited.
3. A Tool Built by an Engineer, for Engineers
This isn’t a theoretical solution, it’s a practical tool born from real-world frustration. As someone with 20+ years of OCNCC, and real-time charging experience, I designed this dissector to solve the exact problems my team faced in the field.
How to Get the Escher Wireshark Dissector
The dissector is available for licensing to organisations and individuals who need to debug, monitor, or analyse OCNCC traffic. Here’s how to get it:
Licensing Options
| Option | Description | Best For |
|---|---|---|
| Single-User License | One-time fee for personal use (non-commercial). | Independent engineers. |
| Team License | Up to 10 users within a single organisation. | Small to medium telecom teams. |
| Enterprise License | Unlimited users + customisation support. | Large enterprises or MNOs. |
| Custom Development | Need additional features or integration with other tools? Let’s talk. | Tailored solutions. |
Next Steps
- Contact Me: Reach out via the contact form to discuss your needs.
- Demo Available: I can provide a short demo of the dissector in action (via screen share).
- Customisation: Need support for a specific OCNCC version or functionality? I can tailor the dissector or build SDK solutions to your requirements.